Car Accident Statistics: 23 Facts and Fatal Trends
Read about the sobering # of Americans who die in car accidents every year and the surprising trend in car accident statistics.
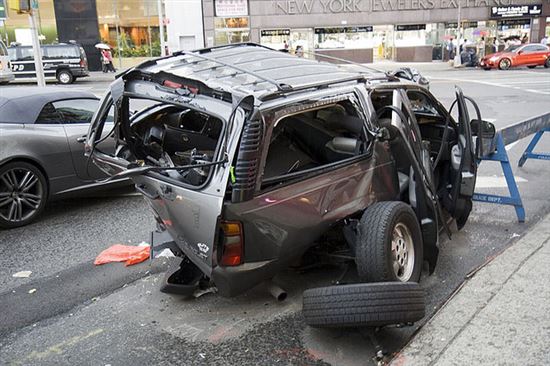 |
| © adrian8_8 (CC BY 2.0) via Flickr |
Being involved in a minor fender bender can certainly be a nuisance but when an accident is more serious, it has the potential to be a life-changing event. Aside from the financial cost that goes along with dinging up your car or someone else's, there's also the risk of being seriously injured or even losing your life as the result of a crash. If you've never been through a car accident, you may not realize just how common they actually are and what kind of damage they can cause.
In an effort to shed some light on the subject, CreditDonkey took an in-depth look at the research on car accidents in America. Using data from the National Highway Traffic Safety Administration and the Insurance Institute for Highway Safety, we were able to round up the 23 most surprising and revealing statistics on motor vehicle accidents in the U.S.
CAR ACCIDENT TRENDS
For the first part of our study, we chose to focus on how often car accidents occur and the likelihood of a death or injury. We also considered how often speed plays a role in car crashes.
1. How many car accidents occur each year?
A total of 5,687,000 car accidents were reported in the U.S. in 2013. That's 72,000 more than 2012, for an overall increase of 1.3%.
2. How many Americans die in car accidents annually?
While the number of car accidents that happen each year is creeping up, fatalities are actually on the decline. In 2013, 32,719 people lost their lives in a car crash, which is 3.1% less than the previous year.
3. How many people are injured in motor vehicle accidents?
Another 2,313,000 people suffered some type of injury in connection with a car accident in 2013. Compared to 2012, that's a decrease of 2.1%, or about 49,000 people.
4. How many crashes involve property damage only?
By and large, accidents involving damage to property are more common than those that lead to deaths or injuries. Around 4,066,000 crashes resulted in property damage in 2013, a jump of 2.9% over 2012.
5. How often are pedestrians involved in traffic accidents?
While deaths and injuries are most common among passengers and drivers, those outside the vehicle are also at risk. In 2013, 4,735 pedestrians were killed in a car accident and another 66,000 were injured.
6. What about motorcyclists?
Motorcyclists had a slightly smaller chance of dying in a accident but they were more likely to get hurt. There were approximately 4,668 fatalities and 88,000 injuries reported in 2013.
7. How often is speed a factor in fatal accidents?
Speed was reportedly a factor in 9,613 of the fatal crashes that occurred in 2013. That's 29% of all fatal accidents.
8. Where do most fatal speeding accidents occur?
Surprisingly, interstates and freeways aren't the most hazardous for speeding drivers. Thirty-five percent of all deadly accidents involving speed reported in 2013 happened along minor roads.
MEASURING DRIVER SAFETY
After analyzing the most recent car accident data, we looked at how accident, injury and death rates have changed over time. We also looked at which months and states tend to be the most perilous for drivers.
9. Are injuries and deaths becoming less common?
Over the last 50 years, the fatality rate has been on a steady decline, with the average fatality rate dipping from 5.39 deaths per 100 million Vehicle Miles Traveled (VMT) to 1.10. Since 1989, the injury rate has dropped from 157 per 100 million VMT to 78.
10. What percentage of Americans wear their seatbelt?
As of 2014, approximately 87% of people in the U.S. reported buckling up on a regular basis. The rate increases to 90% in states where the law permits officers to pull drivers over solely for not wearing a seatbelt.
11. How does seatbelt use affect accident fatalities?
Seatbelt use can reduce the odds of an accident turning deadly, but it's not a guarantee. Of the fatal accidents that occurred in 2013, 73% of people who used restraints survived but the remaining 27% weren't so fortunate.
12. Which month is the most accident-prone?
Warmer weather usually means more people on the roads as they head out on vacation, and late summer is prime time for an accident. In 2013, 10% of all fatal crashes occurred in August.
13. Which is the least?
When cold weather, ice and snow keep people indoors, the accident rate tends to drop. February was the safest month for drivers in 2013, with just 6% of all fatal accidents reported.
14. What state reports the most car accident deaths?
The Lone Star state topped the list as the most dangerous for drivers and passengers in 2013, with 3,382 fatalities recorded. California was a close second with 3,000, while the District of Columbia reported the lowest number of deaths, with 20.
CAR ACCIDENTS AND ALCOHOL USE
Driving while intoxicated can result in some serious legal consequences if you end up getting pulled over. The impact is even more severe if it leads to an accident. For the final part of our study, we broke down the numbers on alcohol-related crashes.
15. How often is alcohol a factor in traffic deaths?
Approximately 10,076 people were killed in alcohol-related accidents in 2013. These deaths accounted for 31% of all fatal car accidents that were reported that year.
16. How frequently do alcohol-related fatalities occur?
Based on the most recent data available, it's estimated that someone is killed in a car accident (where alcohol played a part) every 52 minutes .
17. Are drivers or passengers at greatest risk?
When driving under the influence of alcohol results in a fatal accident, it's the person behind the wheel who tends to pay the price. Drivers made up 65% of those killed in alcohol-related accidents in 2013.
18. What age group has the highest accident rate?
Young adults are most at risk for being involved in an alcohol-related accident, with drivers aged 21 to 24 accounting for 33% of all fatal crashes in 2013. Drivers in the 25 to 34 range followed closely behind, at 29%.
19. Which state has the highest number of alcohol-related crashes?
Texas reported the largest share of fatal car accidents involving an impaired driver in 2013, with 1,337 deaths . Washington, DC had the fewest, with just 6.
20. How many children are killed in alcohol-related accidents?
A total of 1,149 children aged 14 or younger died as a result of a traffic accident in 2013. Approximately 200 of those deaths, or 17%, involved a driver who was impaired at the time the crash occurred.
21. What time of day do most alcohol-related accidents occur?
In 2013, impaired drivers were nearly four times as likely to be involved in an accident at night versus the daytime. Thirty percent of fatal accidents where alcohol was a factor happened on the weekend, and 40% of those were reported between the hours of 6 pm and 5:59 am.
22. What's the financial toll of car accidents?
It's estimated that in terms of economic loss and societal harm, car crashes cost the U.S. $871 billion each year. That breaks down to roughly $900 for every person in the country.
23. How much do alcohol-related crashes cost?
Crashes that are caused by drivers who are under the influence cost the nation about $49 billion annually, for an average of $158 per person. When you factor in lost qualify of life, the price tag for alcohol-related accidents balloons to $199 billion.
CONCLUSION
While the financial cost of car accidents is staggering, it's nothing compared to the emotional impact it can have on the people who are directly affected by a crash. The statistics we found do have a silver lining, however, since the odds of being hurt or killed in an accident seem to be continuing on a downward slide.
Sources and References:
Rebecca Lake is a journalist at CreditDonkey, a credit card comparison and reviews website. Write to Rebecca Lake at rebecca@creditdonkey.com. Follow us on Twitter and Facebook for our latest posts.
Read Next:
